Risk Matrix Configuration
How to create, configure, and assign a risk matrix in Clew
Contents
- 1. Introduction & Context
- 2. Key Features & Functions
- 3. Requirements
- 4. Step-by-Step Guide
- 5. Common Issues & Troubleshooting
- 6. Related Articles
1. Introduction & Context
A risk matrix is a visual tool in Clew that lets you assess and prioritise risks based on their likelihood (the chance of occurring) and severity (the impact if they occur), so your team can decide which risks need immediate attention and how to direct mitigation effort.
For example, a mining operation might rate a potential equipment failure as high severity but low likelihood, while a recurring data-entry error is low severity but high likelihood. The matrix scores each combination so both risks can be compared on a single, consistent scale.
Who is it for? Administrators and risk managers who configure how risks are rated and displayed across projects.
What does it impact? Once a matrix is assigned via a rating strategy, it governs how every risk in the linked project and custom type is rated, scored, and colour-coded. Rating scores are often connected to triggers, so changes to a matrix can affect automated behaviour elsewhere in the platform.
2. Key Features & Functions
- Likelihood and severity scales: define the number of likelihood categories (the X-axis) and severity categories (the Y-axis) that make up the grid.
- Consequence categories: group severity against real-world impact areas such as Safety, Finance, Reputation, and Environment.
- Likelihood categories: describe likelihood in the terms your organisation uses, such as Probability, Industry Frequency, and Project Frequency.
- Rating measures: set the score bands that translate a cell score into a named risk level, for example Minor, Moderate, Major, and Extreme.
- Compact views: simplify the likelihood or severity scale by hiding detailed probability, frequency, or definition text.
- Transpose option: switches severity categories to the top and likelihoods to the side.
- Ascending option: controls whether the highest or lowest rating is shown on the risk rating pill.
- Rating strategies: assign a matrix to a project and custom type so it is used for live risk assessment.
3. Requirements
- Administrator access to the Admin area of Clew.
- Access to Admin > Risk Matrices to create and edit matrices.
- A project and custom type to link the matrix to, configured through Rating Strategies.
4. Step-by-Step Guide
Creating a Risk Matrix
- Navigate to Admin > Risk Matrices.
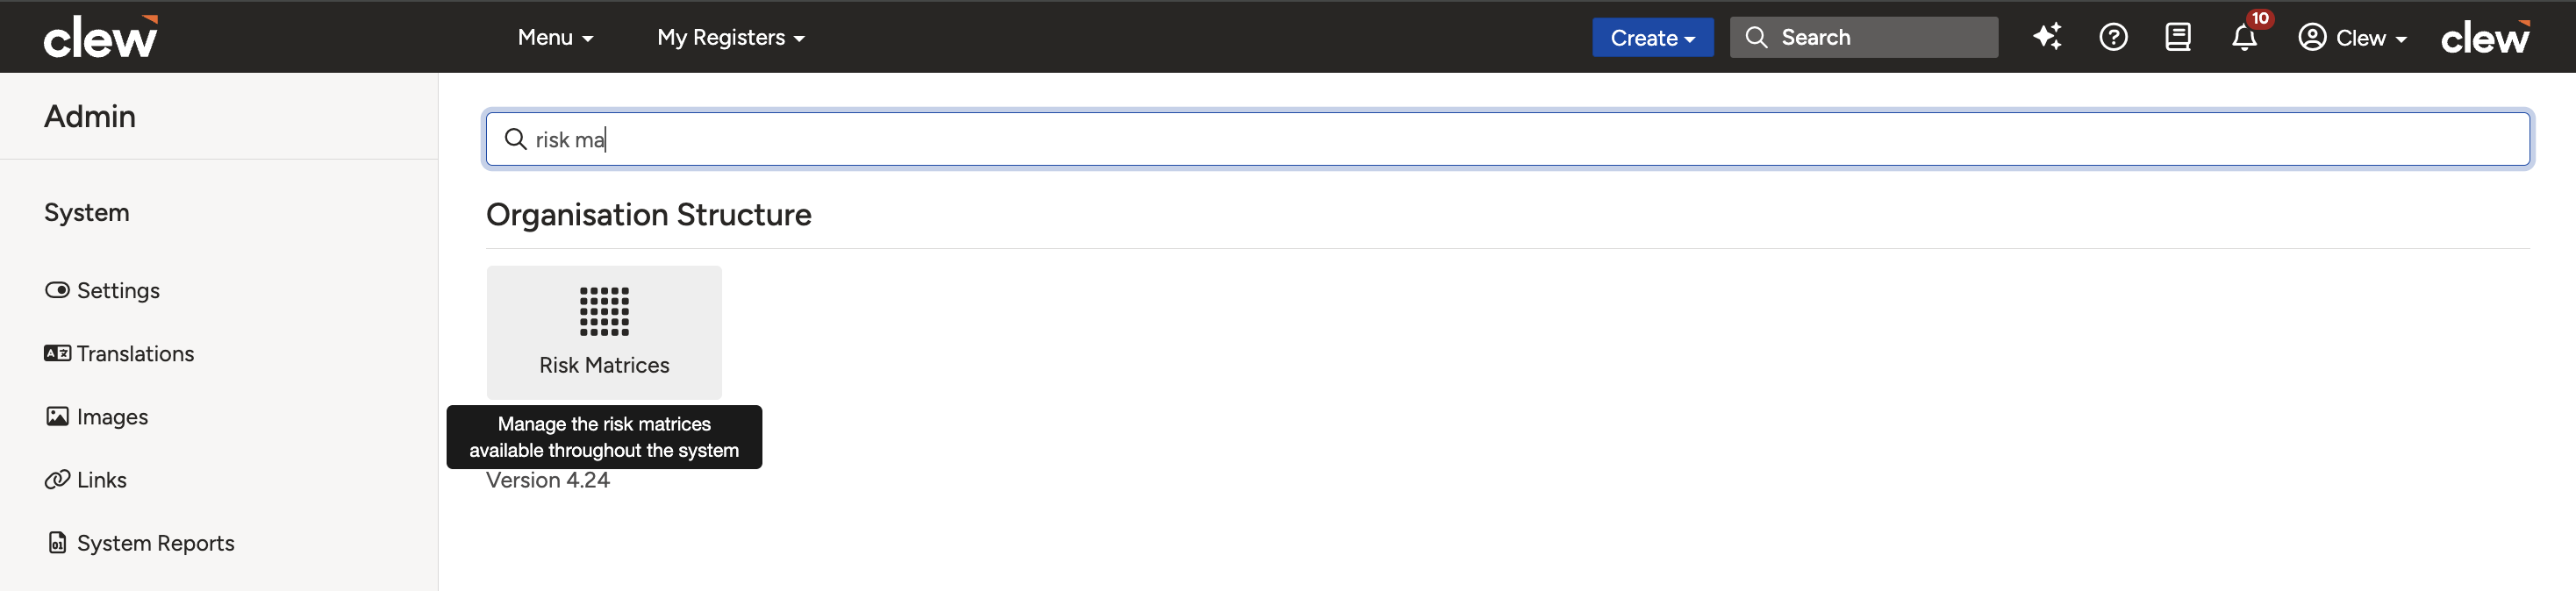
The Admin menu with Risk Matrices selected.
- Click Add to create a new risk matrix.

The Add button used to create a new risk matrix.
- Fill in the required fields, described in the table below.
| Field | Description |
| Title | Name of the risk matrix (for example, Default Risk Matrix). |
| Description | Brief description of the matrix. |
| Number of Likelihoods | Define the number of likelihood categories (X-axis). |
| Number of Severities | Define the number of severity categories (Y-axis). |
| Define Views | Compact Likelihood View: simplifies the likelihood scale without probability or frequency details. Compact Severity View: simplifies the severity scale without detailed definitions. |
| Matrix Type | Type of matrix. These values are pre-configured. Select Default Risk Matrix in this field. |
| Custom Image | Select an image for the matrix. It appears as a popup when you click the i icon beside the matrix name on the rating show view. |
| Ascending Option | Tick to show the highest rating on the risk rating pill. |
| Round Decimal Cell Scores | Rounds decimal scores to the nearest integer. |
| Transpose Option | Switches severity categories to the top and likelihoods to the side. After transposing a matrix, a note is shown at the top of the admin risk matrix to indicate it will be transposed during rating. This does not apply when rating in Severity Focus or PMC mode. |
| Footnotes | Provide additional notes or references. |
- Click Save to apply the changes.
The risk matrix configuration form with the Save button.
Defining Categories & Rating Measures
- Define consequence categories. Click Add Consequence Category and enter relevant categories (for example, Safety, Finance, Reputation, Environment).
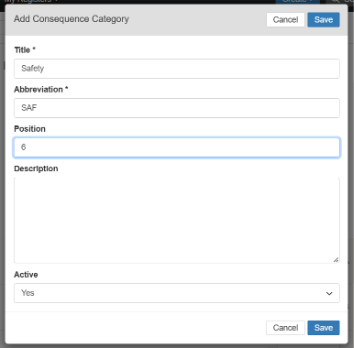
Adding consequence categories such as Safety, Finance, Reputation, and Environment.
- Define likelihood categories. Click Add Likelihood Category and enter relevant categories (for example, Probability, Industry Frequency, Project Frequency).
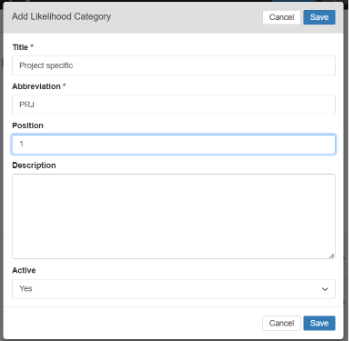
Adding likelihood categories such as Probability, Industry Frequency, and Project Frequency.
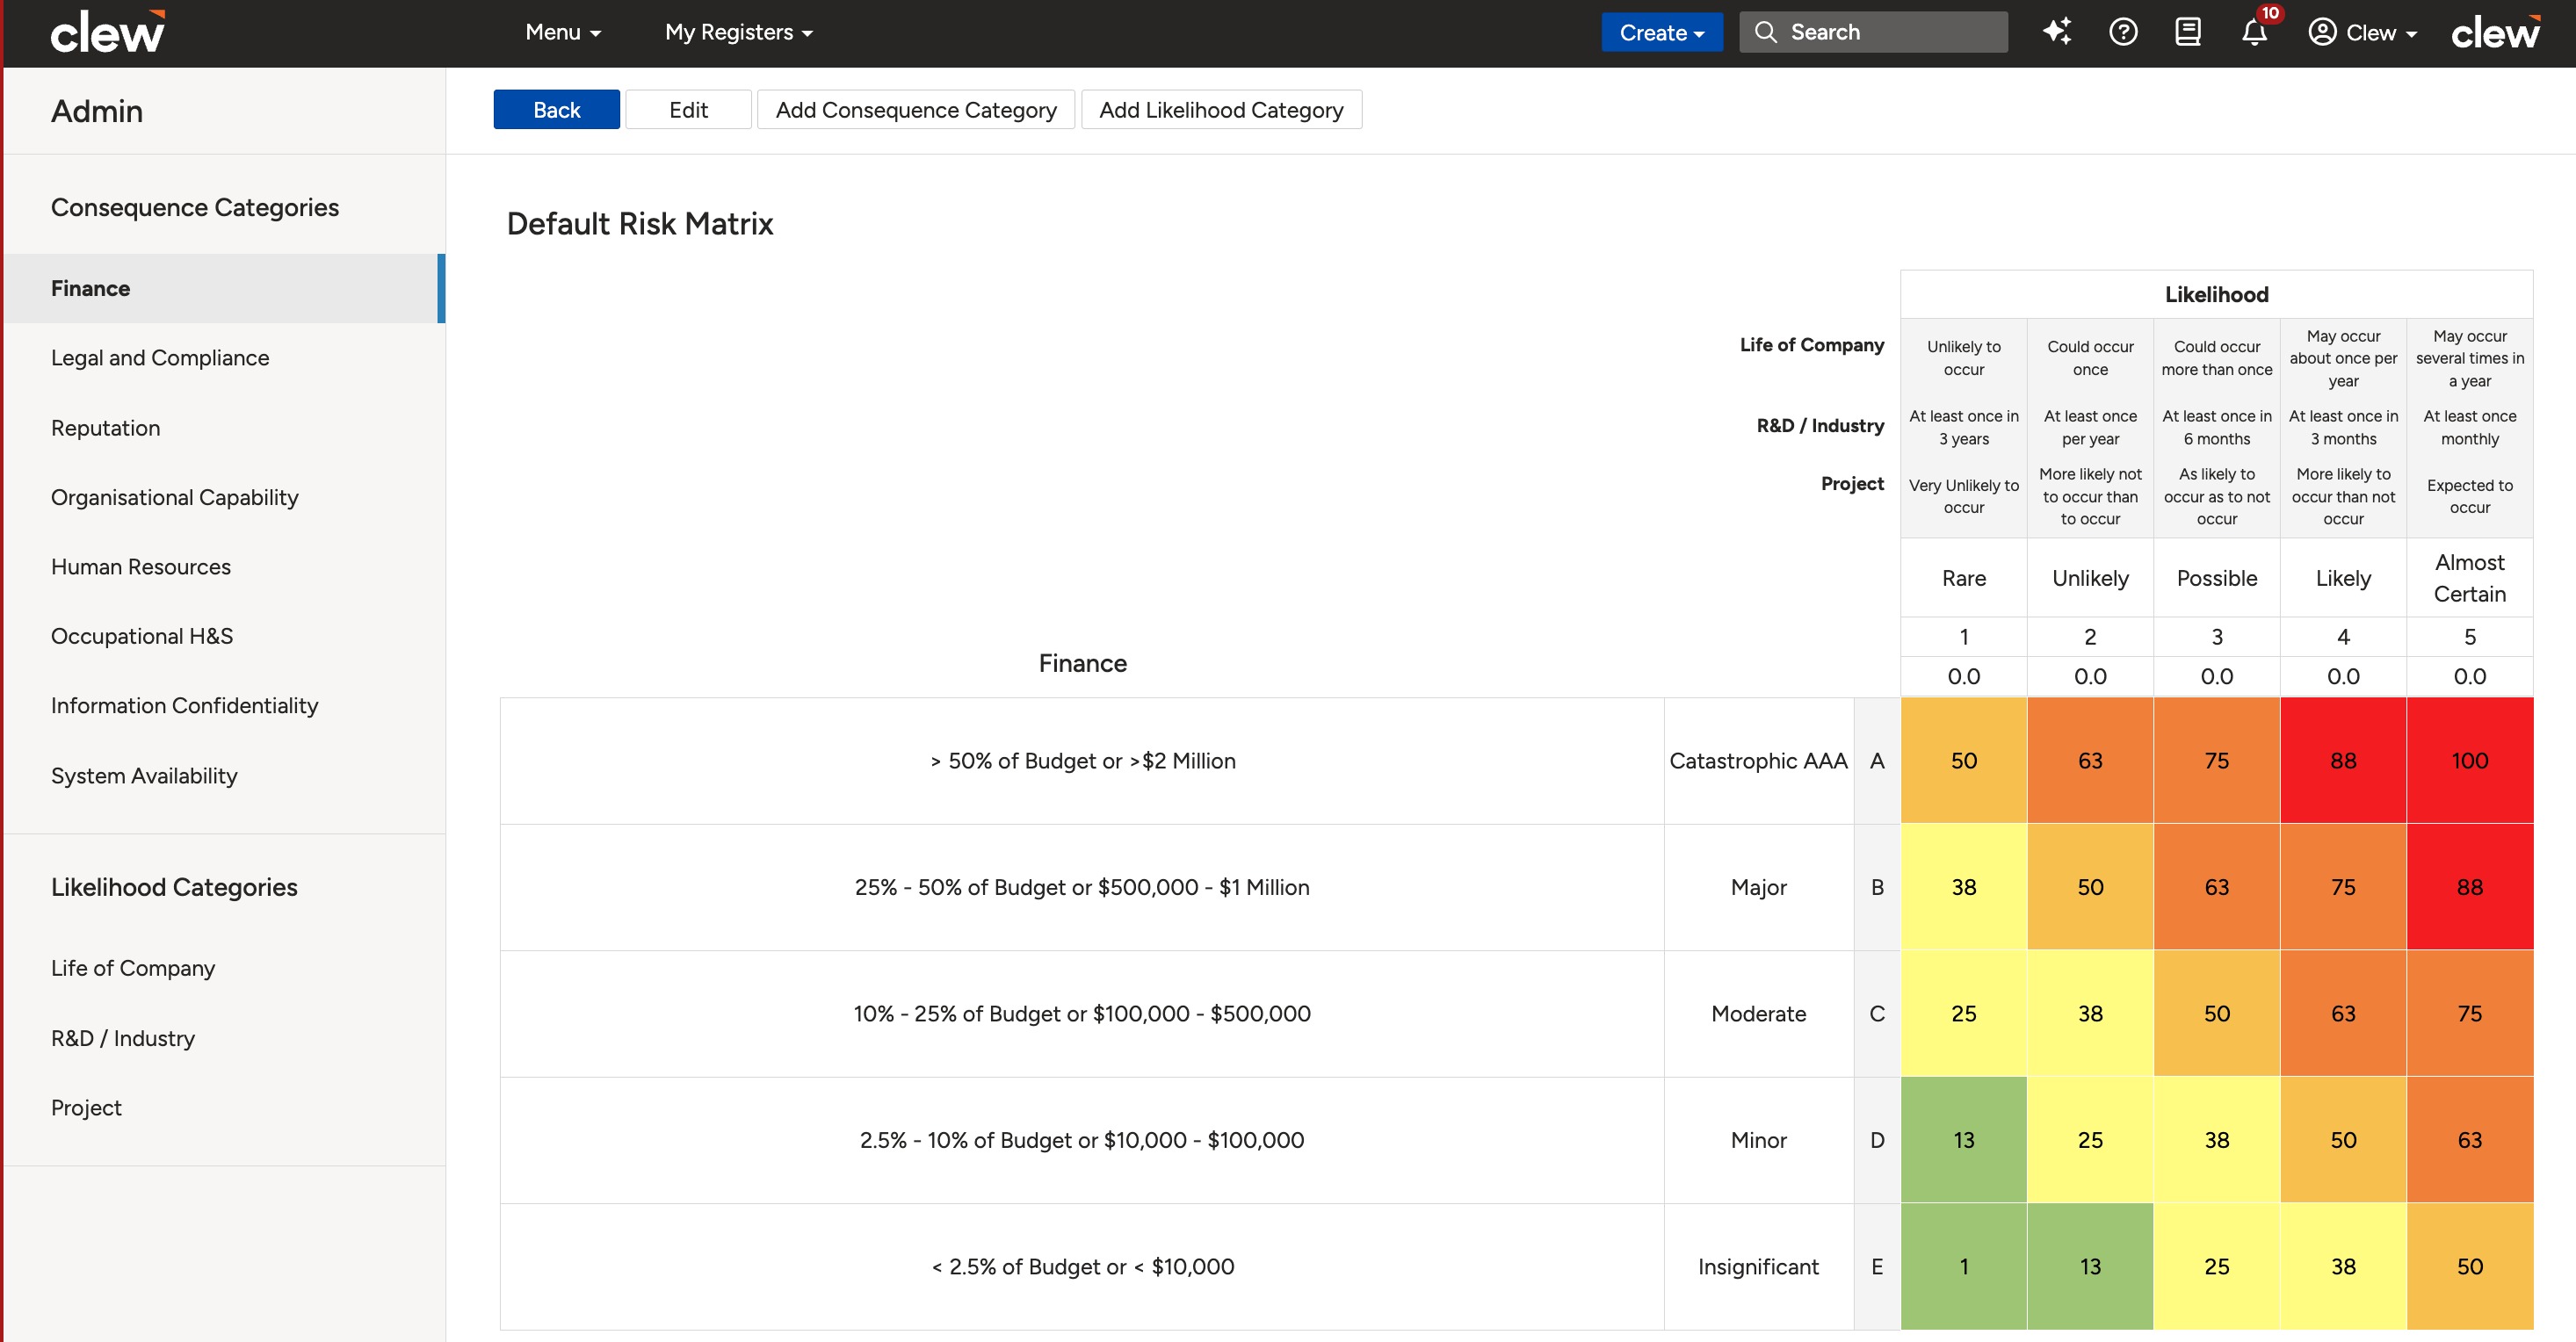
- Define rating measures. Click a cell to activate it and enter the appropriate risk levels (for example, 0 to 25 Minor, 25 to 50 Moderate, 50 to 75 Major, 75 to 100 Extreme).
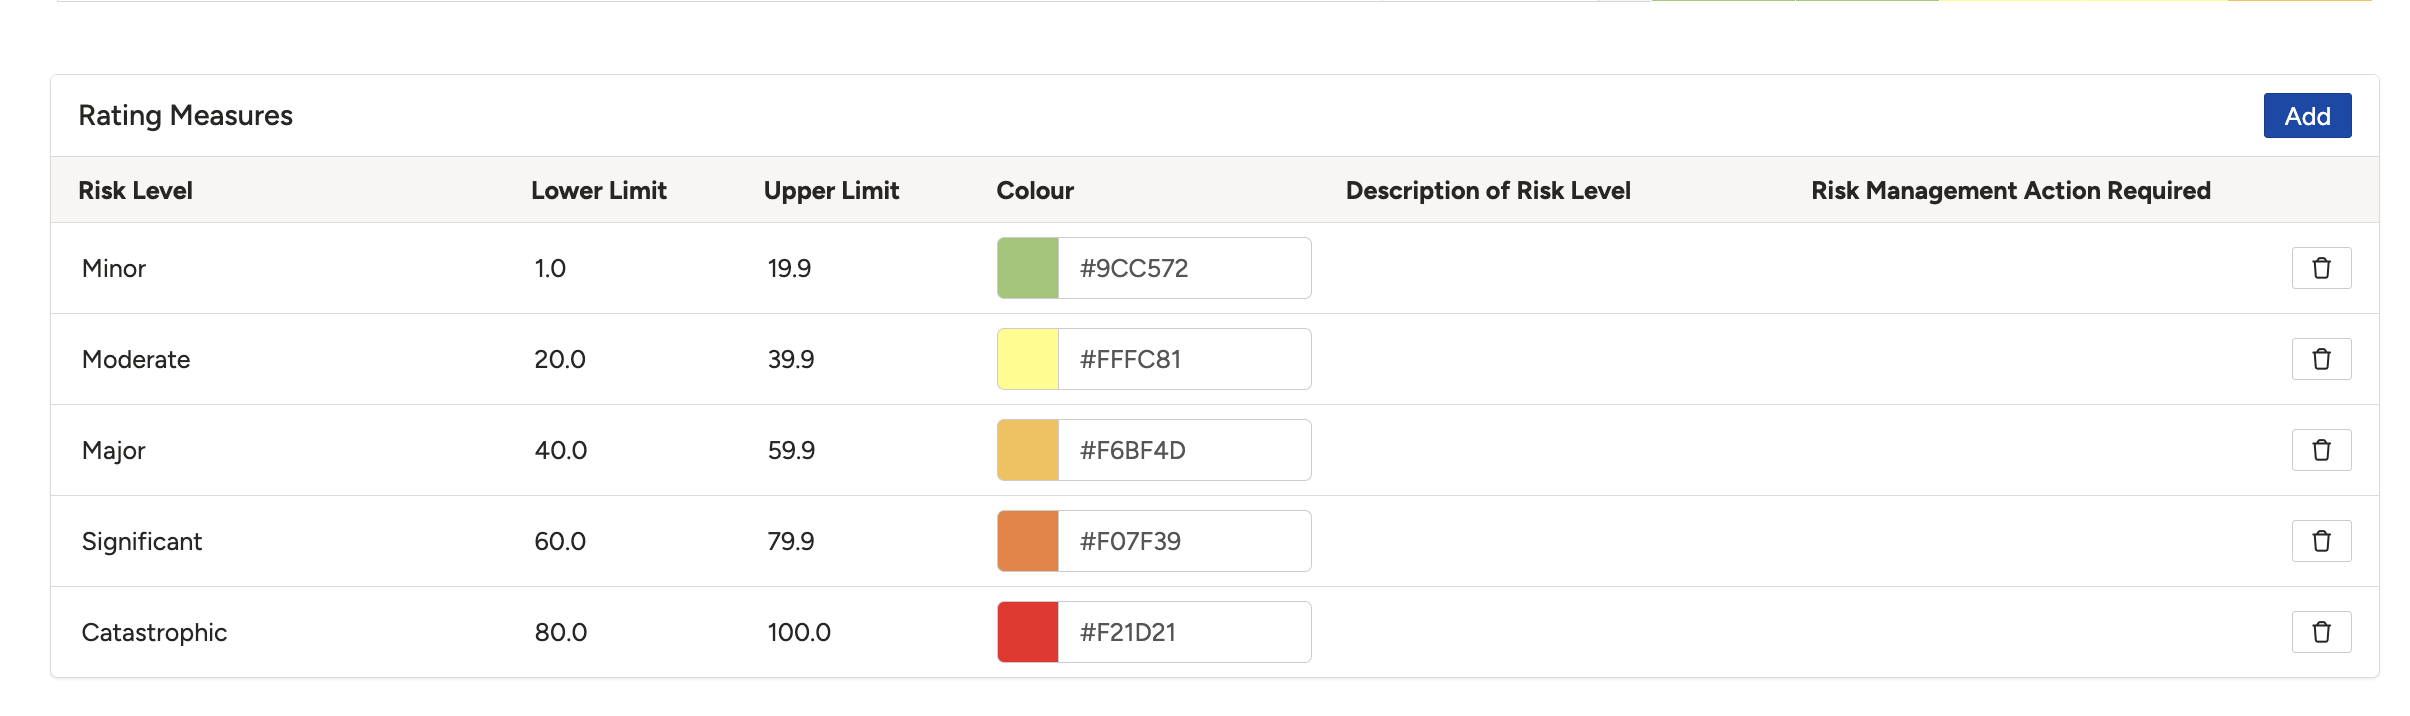
Rating measures defining risk levels such as Minor, Moderate, Major, and Extreme.
Assigning the Matrix
- Assign the matrix. Link it to a project and custom type via Rating Strategies to begin using the matrix for risk assessment.

Linking the matrix to a project and custom type via Rating Strategies.
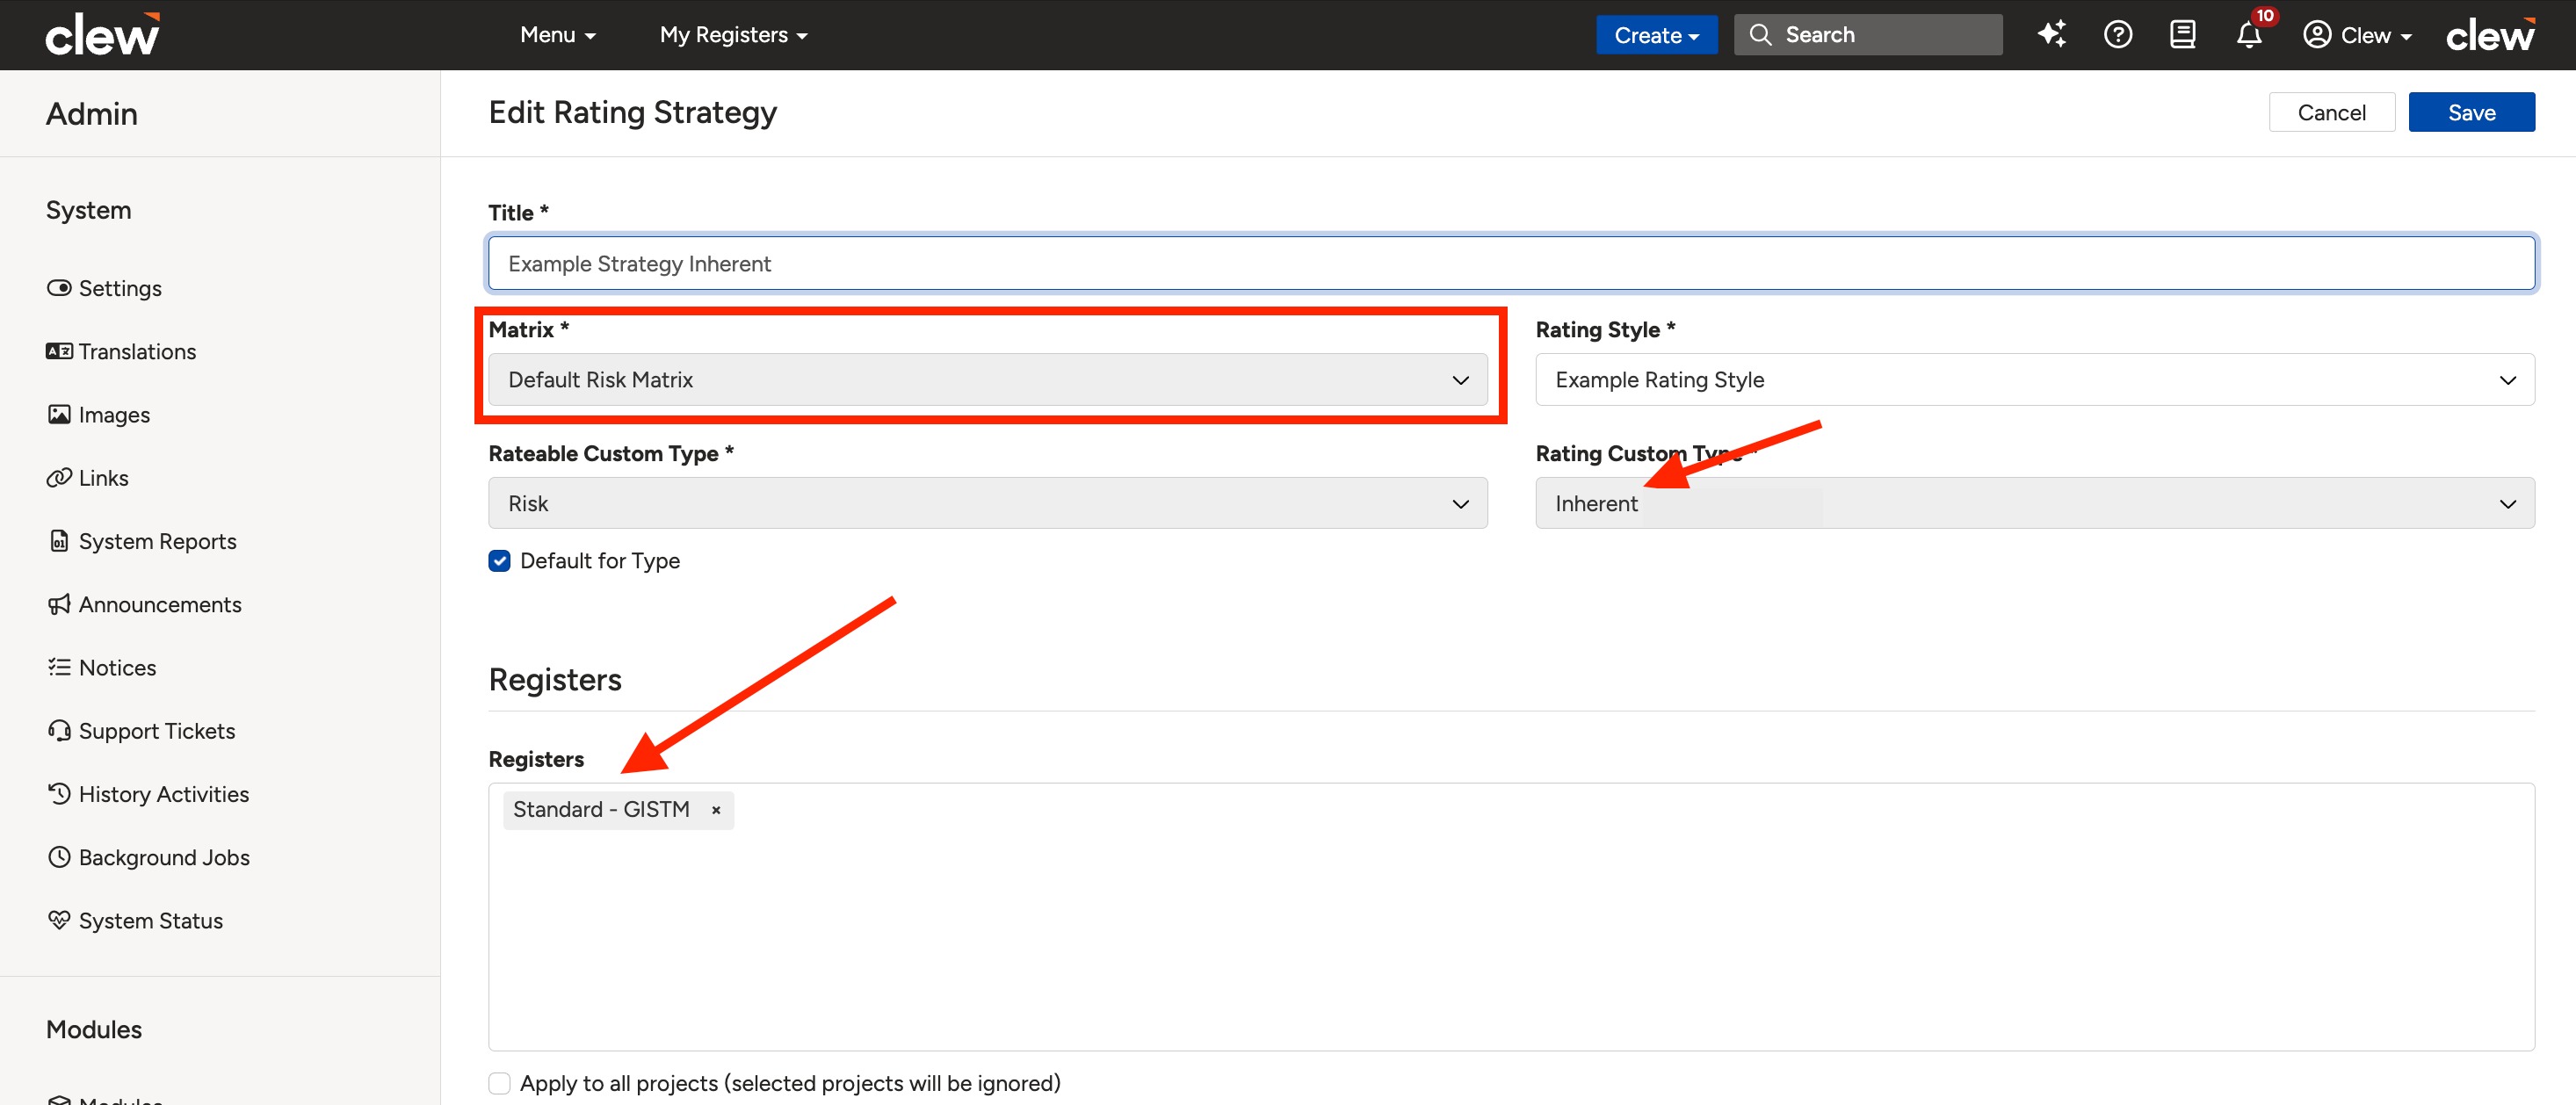
The configured matrix in use, with colour-coded rating cells.
5. Common Issues & Troubleshooting
| Issue | Likely Cause | Solution |
| The matrix is not available when rating a risk. | The matrix has not been assigned to the project and custom type. | Link the matrix to the relevant project and custom type via Rating Strategies. |
| Two cells show the same score but different colours on the risk show view. | Decimal rounding is enabled, so cells display the same integer while retaining different underlying risk levels. | This is expected behaviour. To show exact scores, turn off Round Decimal Cell Scores in the matrix edit view. |
| The rating pill shows the highest rating when you want the lowest (or the reverse). | The Ascending option controls which rating is displayed. | Tick or untick the Ascending checkbox in the Admin Risk Matrix edit view. |
| A severity or likelihood category cannot be deleted. | Categories cannot be deleted, only deactivated. | Hover over the category, click the edit icon, set Active to No, and click Save. |
| Changing a rating score produced unexpected results elsewhere. | Rating scores are often connected to triggers. | Review any triggers linked to the matrix before editing scores, and confirm they still behave as intended afterwards. |
Best practices:
- Agree your likelihood and severity scales before building the matrix, as the number of categories shapes the whole grid.
- Use consequence categories that match how your organisation already talks about impact, so ratings are intuitive for end users.
- Review connected triggers whenever you change rating scores or measures.
- Deactivate categories you no longer need rather than trying to remove them, to preserve historical ratings.
Click a title to preview it here. Use the Open full article button to read the full version in a new tab.
▾Can I hide severity, probability or frequency definitions on the risk matrix? Open full article »
Related article
Using the Compact Likelihood and Compact Severity views to hide detailed probability, frequency, and definition text.
▾Can I view all severity categories on one page instead of navigating through them? Open full article »
Related article
Displaying all severity categories together rather than paging through them one at a time.
▾Can I view the lowest risk rating instead of the highest in the Risk Show View? Open full article »
Related article
Using the Ascending option to control whether the highest or lowest rating appears on the risk rating pill.
▾Can I change the rating score values? Open full article »
Related article
Editing rating measures and score bands, and the effect this can have on connected triggers.
▾How do I reposition severity categories in the left pane? Open full article »
Related article
Reordering severity categories so they appear in the sequence you want in the left pane.
▾How do I change the rating metrics? Open full article »
Related article
Adjusting the rating metrics used to score each cell in the matrix.
▾Why do two cells with the same score show different colours on the risk show view? Open full article »
Related article
Why decimal rounding can make two cells display the same integer while keeping different underlying risk levels.
▾Can we delete severity or likelihood categories in an admin matrix? Open full article »
Related article
Why categories can only be deactivated rather than deleted, and how to do it.
Was this article helpful?
That’s Great!
Thank you for your feedback
Sorry! We couldn't be helpful
Thank you for your feedback
Feedback sent
We appreciate your effort and will try to fix the article